
| 2003 |
|
2003 was the year the United States invaded Iraq. It was the year the Space Shuttle crashed on reentry. It was the year that the stock market finally recovered after one of its longest downturns in history. 2003 was also very much the year of the web log. For the first time ordinary people were using the Internet to discuss current events in such large numbers that their collective discourse began to have a discernable effect on the outcome of those events. In January we learned that weblogs had played a role in Trent Lott's fall from grace. During the summer foreign policy analysts were factoring weblogs into their understanding of international coorespondence. By the end of the year a serious contender for the U.S. Presidency was funding his campaign largely though donations made via his web page. Of course, all of these events where discussed in our corner of the blogosphere - MemeStreams. For those of you who aren't familiar with our site, it is a weblog community powered by an indirected social networking technology known as a reputation system. It has been a little over a year since we first posted some early visualizations based on the data in the reputation system. Shortly thereafter, we added a graph based Social Network Browser to our site... It has been quite some time since we last updated the site. However, work on a new version of the software is underway, with significant improvements to the UI and the underlying infrastructure in the works. These improvements will allow us to roll out new updates and features more rapidly in the future. In order to demonstrate some of the technology we're developing, we've put together this collection of graphs showing the activity on the site over the past year. This collection was created using capabilities that will be present in the next update to the site. For each week of 2003, we provide a graph of that week's social network activity, the most popular discussions, and the most popular users. Every link between people in the graphs represents at least one blog entry that was read and re-recommended; hence propagated further through the network. The arrows point to sources; they represent the flow of reputation. The users in each graph are those whose memes were re-recommended in the preceding two weeks. Users are colored depending on their popularity that week, with the highest scores getting the brightest colors. Links are only mapped for memes posted on a user's MemeStream. Replies in threads are not graphed. The Year in Memes was created by Rattle. Thanks go out to the following: GraphViz does all the hard work, ImageMagick does all the heavy lifting, Ghostscript makes the lines smooth, Joe Gawlik helped with colors, The MemeStreams Community provided all the data, and Mark Lombardi saw the way forward through the fog. Update: There is now a Year in Graphs available for 2004. |
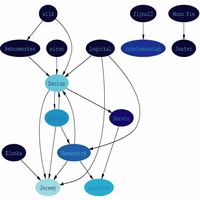 Week #1: Jan 1 - Jan 7 Pattern Recognition and Visualizing MemeStreams |
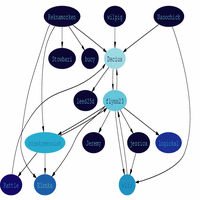 Week #2: Jan 8 - Jan 14 Fast cars, Bush Remixes, and Corporate Lies |
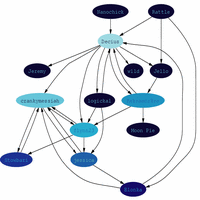 Week #3: Jan 15 - Jan 21 Worldometers and Network Paradox |
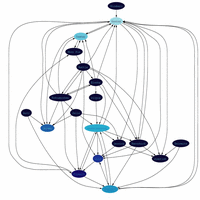 Week #4: Jan 22 - Jan 28 The problems with Music and SUVs |
 |